In this post, I will continue my journey into writing high-performance C# and .NET Core code by taking a look at a benchmarking challenge I recently encountered.
While writing some sample code for an upcoming talk, I wanted to create a demo based on a scenario that I’d experienced at work. In that scenario, I had some code in a worker service. The service is responsible for parsing data from some tab separated files stored on S3. The files, in this case, are CloudFront log files and we needed to process about 75 files a day, each with on average at least 10,000 lines. We needed to grab data from 3 of the columns for each row and index that data into an ElasticSearch cluster.
The existing service uses the following processing flow:
- Stream the bytes of the S3 file via the AWS SDK
- Decompress the bytes using a GzipStream
- Convert the bytes to a string as the input to a library called TinyCsvParser which supports parsing tab separated values (TSV)
- Using TinyCsvParser, extract string data from three columns of the twenty-five columns available
- Construct an object using the data from the three columns
- Index the data into ElasticSearch
I was aware, due to us occasionally hitting our container memory limits in production that this service was not particularly memory efficient. One option we had was to increase the memory limit for the service which would potentially force us to scale the number of VM instances in our cluster; which adds cost. This would be a quick fix but I felt there might be a better way to improve the code and avoid the need to scale.
I spent a little time prototyping an approach where I would create a custom parser based on Span<T>. The exact details of the code changes are beyond the scope of this post. In this post, we’ll focus on an issue I ran into when benchmarking to compare the original code against the optimised version.
Initially, I put together a small benchmark which would load a file, parse its 10,000 lines and complete. My complete benchmark code looks like this…
I won’t go into great detail here about how this benchmark code works. In short, during the setup, it sets the file path to the location of a sample CloudFront log file which contains 10,000 entries. The benchmarks then executes the ParseAsync methods for both the original and the optimised variants of the code. Parsing occurs in a loop to represent the daily processing requirement of approximately 75 files.
I then went ahead and executed the benchmarks on my PC. I’ve covered basic benchmarking in my previous post if you want to learn more about that process. The output from the benchmark run was as follows:
The first column we’re interested in is the ‘Mean’ execution time. The new code is performing significantly more quickly which is good to see. In this case, execution time is not very important since both versions are quick enough, given the small number of files we need to process per day. The goal here is reducing memory consumption.
If we look at the ‘Allocated’ column, we see something unexpected. The original service shows 1.45KB of allocations, while the new version shows 1.66KB. That’s actually worse on the face of things! However, one other interesting thing is evident in the data. The estimated gen 0, gen 1 and gen 2 collection counts are way higher in the original service.
At this point I puzzled with the benchmark code for a while, trying to figure out why my numbers appeared to be incorrect. After some time of getting nowhere, I reached out to Adam Sitnik, who works for Microsoft and also is a core contributor and maintainer of Benchmark .NET. Adam very quickly explained what the issue was that I was facing.
On .NET Core, the API which Benchmark .NET uses to get allocation data ‘System.GC.GetAllocatedBytesForCurrentThread()’ only returns allocations for the current thread. Since the code I was trying to benchmark involved async work, I was not getting the full allocation count across all threads.
Note: This is due to be fixed in an upcoming release of Benchmark .NET post preview 6 of .NET Core 3.0. The .NET Core API has been updated to support getting the allocations across all threads in a process, via ‘GC.GetTotalAllocatedBytes’. Adam has already added a PR to Benchmark .NET to make use of this updated API.
In the meantime, Adam recommended that I look at using a tool such as dotMemory to profile the memory usage of the application. I’d only used dotMemory once previously, so I set about reading through their documentation.
It was clear to me early on that because my code executed very fast, it would be difficult to accurately collect memory snapshots by hand. Fortunately, dotMemory has an SDK that can be included in projects which are being profiled. The SDK allows you to control the memory profiling process from code, which includes triggering memory snapshots. This seemed like the perfect solution for my requirements since I could trigger a snapshot immediately before and after executing the code that I wanted to measure.
Profiling with dotMemory and the JetBrains SDK
Let’s take a look at using dotMemory to profile the memory traffic of some .NET Core code.
NOTE: For this post, I am using the latest released version of JetBrains dotMemory which is 2019.1.1.
NOTE: I’m using the .NET Core 3.0 Preview 3 SDK for this post. Profiling memory with dotMemory for .NET Core 3.0 projects is currently not working in Preview 4 and Preview 5 due to changes in the available APIs. This will hopefully be fixed (possibly as early as preview 6) once things settle down and .NET Core 3.0 approaches a final stable release.
In order to profile code, we must first create a new console application project which will execute the code under test. We should make sure that this project has a reference to the library/project which contains the code under test.
Next, we must add a reference to the JetBrains.Profiler.SDK package which is available on Nuget. This package will support us programmatically controlling the profiling of our code.
With that included in our project, we can write some basic code that we plan to profile. Below is a sample of a basic console application which tests my scenario.
This code gets the path to my sample file. It then executes the parsing of the file 75 times for both the original parsing code and then 75 times for the optimised code.
Before executing the code, we make a call to the MemoryProfiler.CollectAllocations to programmatically control dotMemory profiling. This will start the collection of data about all heap allocations which occur.
Before we execute the original code, we also trigger the collection of a snapshot of the current memory using MemoryProfiler.GetSnapshot. We trigger this again after the parsing loop is complete and we trigger the third snapshot after the optimised code parsing loop.
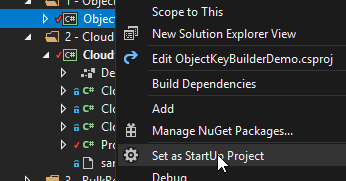
We’re now ready to profile our code. There are various ways to initiate this. We’ll use an approach which assumes that you have the Visual Studio integration for dotMemory installed. You can also trigger a profiling session from dotMemory directly if you prefer. First, we should ensure that the project that exercises the code we wish to profile is set as the startup project. The quickest way is to right-click on the project and choose “Set as StartUp Project” from the menu.
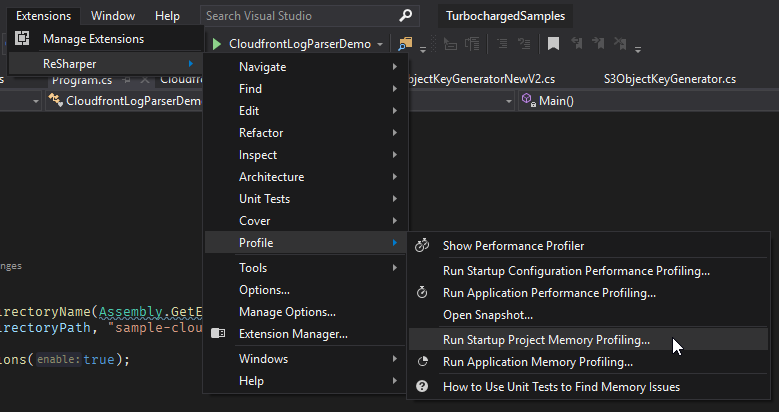
Next, we can start a profiling session from the ReSharper extension. If the dotMemory integration is installed various profiling options will appear under the “Profile” menu. We’ll choose to “Run Startup Project Memory Profiling…”
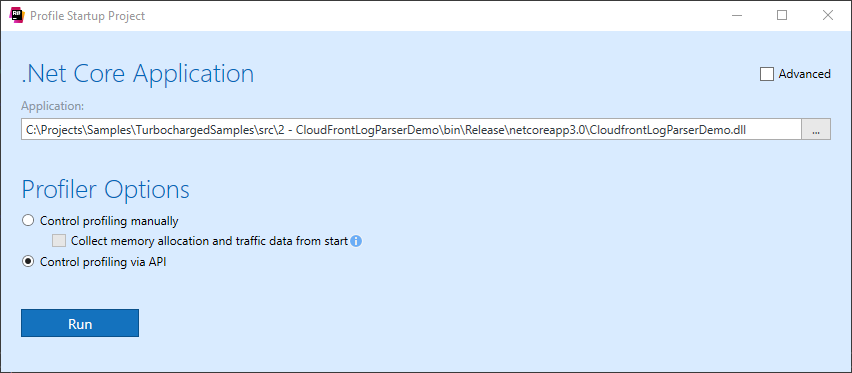
A profiling window will open and the only change we’ll make is to select the profiler option “Control profiling via API”.
JetBrains dotMemory will now launch our project and begin profiling. The session will be controlled by the SDK method calls we included in the Main method of our console application. Once it completes, the profiling session workspace will open. This provides a timeline of the memory information collected during the profiling session. At the bottom of the screen, we can see our three snapshots, triggered by the calls to MemoryProfiler.GetSnapshot.
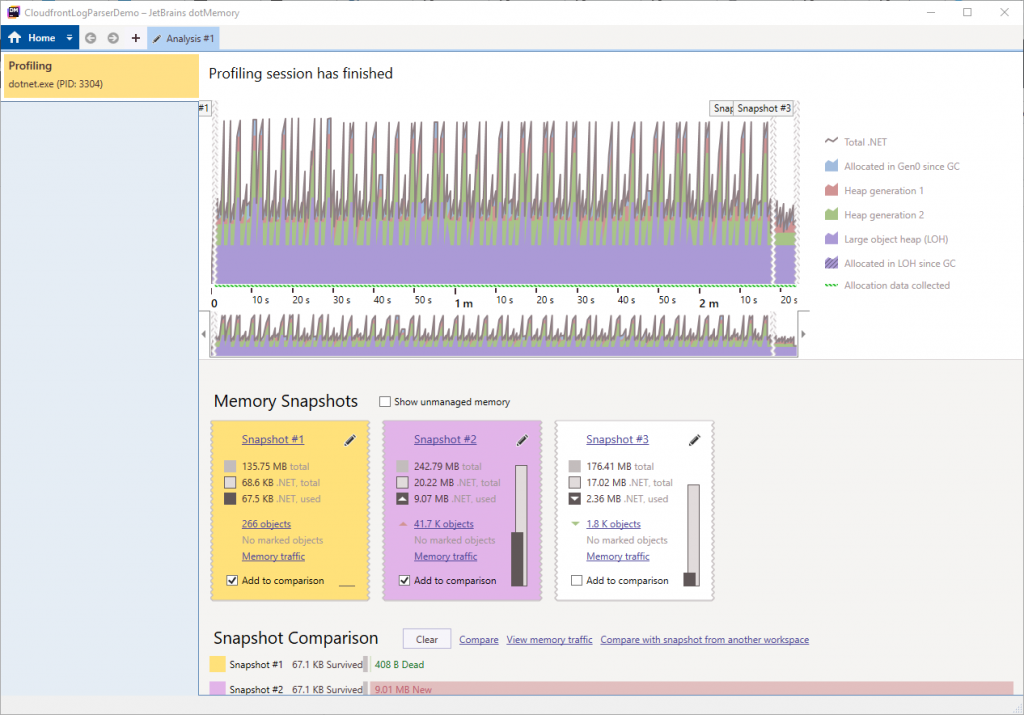
The first and second snapshots are already selected for comparison, so we’ll click the “View memory traffic” link in the comparison area. This will load the Memory traffic comparison.
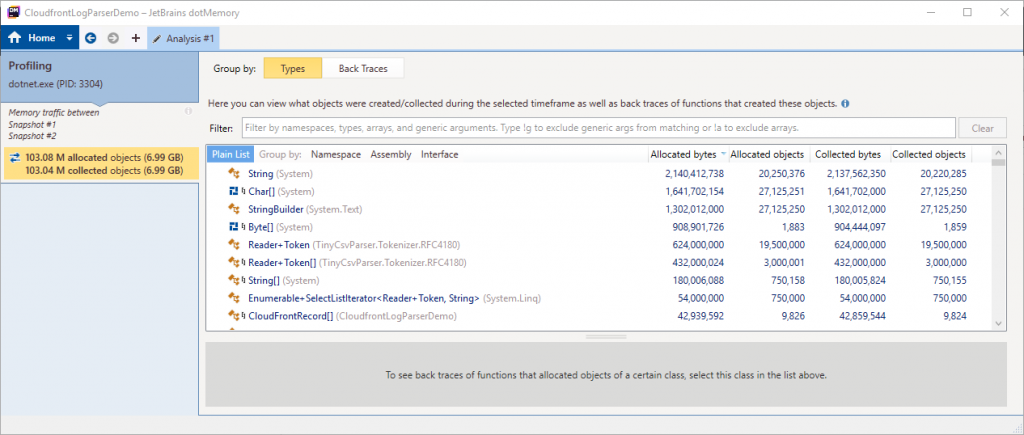
Here we can see the objects which were allocated between the two snapshots. The summary on the left-hand side shows that for our code, which loaded and parsed 75 files, there were nearly 7GB of allocations in total. That’s pretty high and looks like a more realistic number than we saw in the benchmark .NET results.
We can now view a memory traffic comparison between the second and third snapshots.
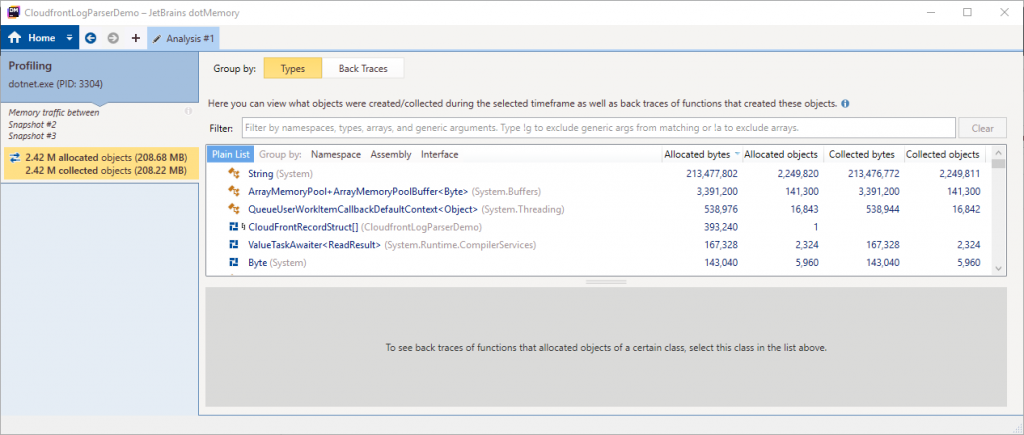
This comparison shows that our new code allocated 208.68MB of memory during its execution, that’s a 97% decrease in allocations! This is much more representative of the change I’d hoped to make with my optimised code.
I haven’t dug too deeply yet, but of this 208.68MB, about 203.56MB is from the string allocations which are mostly the strings I actually required to form the objects that will be indexed to ElasticSearch. These are unavoidable if using the NEST library for ElasticSearch. In future investigations, I will look at using the low-level ElasticSearch client which supports sending raw bytes and may allow me to avoid even these string allocations.
For now, this is good progress! We’ve reduced the numerous allocations and this will also reduce the number of garbage collections which occur. A quick glance at the memory graph from the earlier screenshot also shows that we’ve reduced the peak memory usage in the optimised code and crucially we’ve avoided large object heap allocations. I’ll dedicate a future post to interpreting the dotMemory results in more detail.
Summary
Don’t assume anything and review all of the data you collect! It’s important to investigate any unusual results you happen to see. In my case, if I’d taken the memory allocations data from the benchmark results at face value, I would have wrongly assumed there was no improvement from my optimised code. In my case, I was reasonably confident that I should see some reduction in allocated memory, so that inspired me to dig deeper. In more common micro-benchmarking scenarios, it may be less easy to spot unusual results like this.
Benchmark .NET is a great tool but the limitation currently imposed by the .NET Core API for collecting allocations across threads does impact benchmarking of async code. This is hopefully going to be fixed from .NET Core 3.0 preview 6 and the next version of Benchmark .NET. For the discussion on this see the GitHub issue and recent pull request.
JetBrains dotMemory is a very useful and easy to use tool for performing memory profiling. The SDK, in particular, meant that I was easily able to instrument my code and take memory measurements very quickly.
Thanks for reading! If you’d like to read more about high-performance .NET and C# code, you can see my full blog post series here.
Acknowledgements to:
A big thanks to Adam Sitnik for the information he provided about the .NET allocation count in multi-threaded scenarios when using Benchmark .NET.
Also, my thanks go out to Maarten Balliauw for replying to my tweet and his confirmation that my issue with using dotMemory on Preview 5 of .NET Core was to be expected.
Have you enjoyed this post and found it useful? If so, please consider supporting me: