In this brief blog post, I will share the tale of the mystery surrounding the missing 18 bytes.
While preparing a new conference session on practical application performance optimisation, I reviewed my demo, which includes taking memory profiles as well as benchmarks during the performance optimisation loop. I like to be prepared for any and all questions I may receive. This is one of the benefits of presenting at conferences; by preparing content, I also learn along the way.
While comparing the benchmark results with allocation data from memory profiles, I noticed the byte counts differed by 18 bytes for a specific code path. How can one lose 18 bytes you may ask, well it’s easier than you might think. Some might shrug and say, 18 bytes doesn’t really matter and that the reason is likely a subtle difference in how the profiler collects data vs. benchmark .NET. And in practice, I did, because some small variance is usually not crucial when comparing between tools. But ahead of my talk, I wanted to revisit those pesky missing bytes and understand the difference.
Let’s start by looking at the data I had available. The actual code under test isn’t too important here. It comes from a very functional method which takes an input string representing a SQL statement, and returns two other strings by parsing the input. For a particular statement, my benchmark results were as follows:
So, according to benchmark .NET, parsing this statement causes 312 bytes to be allocated. Fair enough!
In order to understand where those allocations come from, we can use a profiler. My default choice for profiling is dotMemory from JetBrains. My demo application included a small console application that acts as a profiling harness to allow me to profile the method in question. Usually, I use the JetBrains profiling API NuGet package to control profiling, but in this case, to rule out any oddities, I used full collection tracking and had the console application pause for me to take snapshots at the appropriate points. The exact code for the profiling harness isn’t important here, but you can see a version in my demo code.
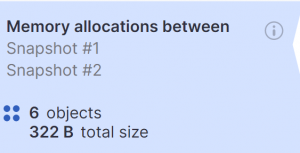
After profiling the application, I compared the memory allocations between my two snapshots. The summary shows 6 objects were allocated, totalling 322 bytes on the heap.
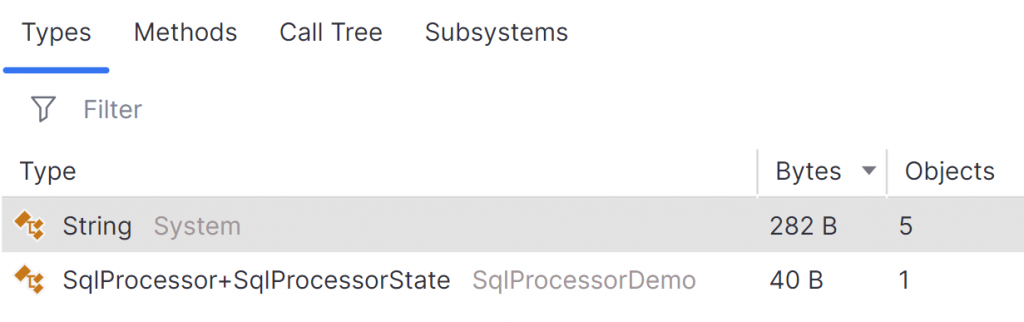
We can see the breakdown by type also.
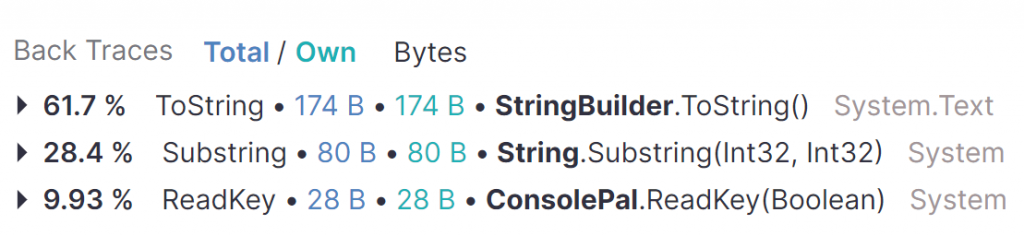
I expected all but one of the objects. There was an extra string showing up in my results so I checked the back traces.
The last string here is 28 bytes and is caused by using Console.ReadKey in my test harness. As this isn’t part of the actual code I’m benchmarking, I will exclude it from the analysis.
So, according to dotMemory, there are 294 bytes allocated, 18 bytes less than benchmark .NET reports. Hmm!
As different tools may differ in their collection methods and the way they calculate the resulting data, I wanted to get a second opinion. This time I loaded up the Visual Studio Performance Profiler and used the .NET Object Allocation Tracking tool to capture my profile data.
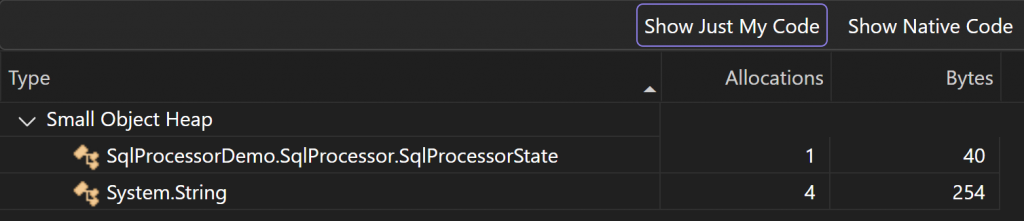
Visual studio allows selection of a particular timeframe in the results, so I was able to avoid analysing any of the test harness allocations. This time, the results were as follows:
So, Visual Studio aligns with dotMemory and reports 294 bytes allocated.
At this point, I went to the code for benchmark .NET on GitHub to check how they are calculating the memory allocations. After a small amount of searching, I confirmed the suspicion that they use GC.GetTotalAllocatedBytes(precise: true) before and after running the benchmark code. This API reports a count of the managed bytes allocated over the lifetime of the process.
I updated my profiling test harness so that I could record the allocations myself using this API and a similar method used to get the allocations only from the current thread.
PrepareForProfiling(0);

Span<long> data = stackalloc long[4];

GC.GetTotalAllocatedBytes(true);
GC.GetAllocatedBytesForCurrentThread();

Console.WriteLine("Take before snapshot");
Console.ReadKey();

GC.Collect();
GC.WaitForPendingFinalizers();
GC.Collect();

data[0] = GC.GetTotalAllocatedBytes(true);
data[1] = GC.GetAllocatedBytesForCurrentThread();

SqlProcessor.GetSanitizedSql("SELECT * FROM Orders d, OrderDetails ox");

data[2] = GC.GetTotalAllocatedBytes(true);
data[3] = GC.GetAllocatedBytesForCurrentThread();

Console.WriteLine("Take after snapshot");
Console.ReadKey();

Console.WriteLine("Total allocated bytes: {0}", data[2] - data[0]);
Console.WriteLine("Total allocated bytes for current thread: {0}", data[3] - data[1]);

Console.ReadKey();
To avoid allocations from the harness muddying the waters, I first allocate a span on the stack for the allocation data. I also warmed up the use of the GC methods. After prompting for the first snapshot, I call both of the GC APIs, storing the results in my stack-allocated memory. Then the code under test is executed, and I then get the latest GC data, before prompting for the second snapshot.
After running this profiler, this is the console output:
Selected mode: vs-memory-profiling
Take before snapshot
Take after snapshot
Total allocated bytes: 312
Total allocated bytes for current thread: 312
The results, unsurprisingly, align with those from benchmark .NET, which rules out any weird edge cases that I wasn’t aware of. But we’re still missing 18 bytes in the profile data. Why?
At this point, I got a little obsessed with tracking down those elusive bytes. At this point, I was a little worried for their safety!!
Given that we only have 5 objects allocated, I decided to calculate the object sizes manually in order to compare them. Let’s start with the SqlProcessorState, which is defined as follows:
internal class SqlProcessorState
{
    public required StringBuilder SanitizedSql { get; init; }
    public required StringBuilder DbQuerySummary { get; init; }
    public bool CaptureNextTokenAsTarget { get; set; }
    public bool InFromClause { get; set; }
}
The two StringBuilder fields hold a reference to the StringBuilder objects, so those require 64bits (8 bytes) each. Each of the Boolean fields requires 1 byte. Therefore, the total size of the fields is:
2 references: 2 × 8 = 16 bytes
2 bools: 2 × 1 = 2 bytes
Total = 18 bytes
However, the size of a class also has some overhead for the object header that we should account for. This requires an extra 16 bytes, bringing our total to 34 bytes.
For the 4 strings, we need to know their length in order to calculate their size. For the two output strings, we can actually view those in the dotMemory compare view for the snapshots. We are also able to view any allocation objects that remain on the heap after the second snapshot. Using this view, I can see the two output strings that remain allocated. Two temporary strings, created by String.Substring are not present in this view as they are short-lived and are collected by the GC during the second snapshot. We’ll work out their lengths manually in a moment.
Strings in .NET store their data in UTF16 encoding. For the first part of the calculation we can take the length (number of characters) and in this case, multiply by two to get the byte overhead. Some characters would require up to four bytes in UTF16, but we’re dealing with standard ASCII compatible characters here.
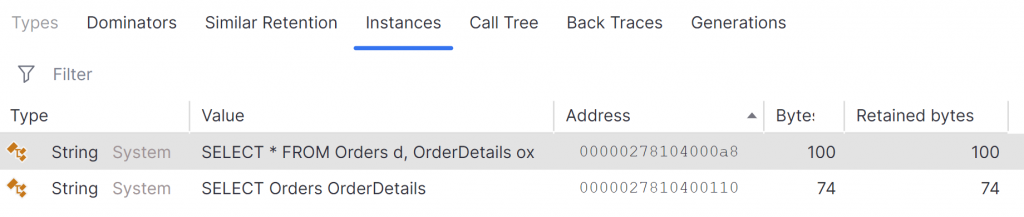
The first string has a length of 39 characters, so requires 78 bytes for the data. String objects also store the size of the string requiring an extra 4 bytes and a further 2 bytes for the null terminator. Finally, we must not forget the 16 bytes for the object header. Therefore we calculate the size of the first string as 100 bytes.
The same calculation can be used for the second string with a length of 26 characters and therefore a size in memory of 74 bytes. This aligns perfectly with the byte sizes reported for these strings in dotMemory.
The final two strings require a review of the implementation to calculate their length based on our input data. The details of that are not important here, but their lengths were 6 characters and 12 characters. Therefore, their memory sizes are 34 bytes and 46 bytes including the 22 byte string overhead. That’s a total of 80 bytes, which again matches what we saw in dotMemory allocation tracking.
On the surface, this implies that dotMemory is reporting the “correct” value, but for some reason, the .NET API is disagreeing by 18 bytes across all five objects.
The key to unlocking this mystery is in understanding the subtle but crucial difference for the source of the allocation data. Profilers use the .NET runtime APIs to provide a callback to various runtime events, such as ObjectAllocated. Those APIs are purely looking at the object size, and calculate those sizes just as we did above. Crucially, though, the GetTotalAllocatedBytes on the GC type is ultimately reported by the .NET garbage collector. The GC has more concerns than just allocating the actual bytes required by the object. It has to deal with implementation details concerning memory access and performance. For that reason, when an object is stored on the heap, it is aligned to an 8 byte boundary, which helps with details such as memory cache-line fragmentation and pointer arithmetic.
So for each object being allocated by the GC, the size is padded to align with the next 8 byte boundary. For our objects, the padding is as follows:
100B string, padded by 4 bytes to 104 bytes (a multiple of 8)
74B string, padded by 6 bytes to 80 bytes
34B string, padded by 6 bytes to 40 bytes
46B string, padded by 2 bytes to 48 bytes
34B SqlProcessorState, padded by 6 bytes to 40 bytes
When we total up the size of these padded objects, we get… wait for it… 312 bytes. We have found the missing 18 bytes in the difference between the benchmark data and the profiler allocation data. The details are in the implementation and specifics of where and how the data is collected. Neither value is wrong; they just differ subtly due to the use of different APIs.
So what did we learn from this mystery? Mostly that benchmark results will differ from profiler data. Worst case, per object allocated, we have a possible maximum variance of 7 bytes between the benchmark data and profile data. We can’t expect to directly compare them, but the totals will still be close enough for general analysis. Benchmarks are perfect for the code-level inner optimisation loop, where we measure – apply a small, targeted change – measure again to validate. The allocation column will show us whether we are removing allocations or not.
If we need to understand exactly what objects contribute to the allocation overhead, we can profile. We can compare one profile with another to understand which allocations we have removed (or introduced) in our code changes. Profiling helps to identify where we might be able to make optimisations, and benchmarks help validate, in a repeatable and more flexible approach, whether each change has the desired impact.
And so concludes this mystery, which, once we talke the time to understand the details, is no longer a mystery, but something useful to keep in mind when optimising code in the future. The GC did it, in the heap allocation, with the candlestick!
Have you enjoyed this post and found it useful? If so, please consider supporting me:
Steve Gordon is a Pluralsight author, 7x Microsoft MVP, and a .NET engineer at Elastic where he maintains the .NET APM agent and related libraries. Steve is passionate about community and all things .NET related, having worked with ASP.NET for over 21 years.
Steve enjoys sharing his knowledge through his blog, in videos and by presenting talks at user groups and conferences. Steve is excited to participate in the active .NET community and founded .NET South East, a .NET Meetup group based in Brighton. He enjoys contributing to and maintaining OSS projects. You can find Steve on most social media platforms as @stevejgordon