In this post, I thought it might be fun to create the world’s (nearly) shortest C# program and then deep dive into some of the fine details of what happens behind the scenes. This post is not intended to solve a real-world problem but I hope it’s well worth your time spent reading it. By investing time to dive into some of the features we take for granted day-to-day, I hope that together, we can learn a little more about how our code transforms into something that can be executed.
Creating the Console Application
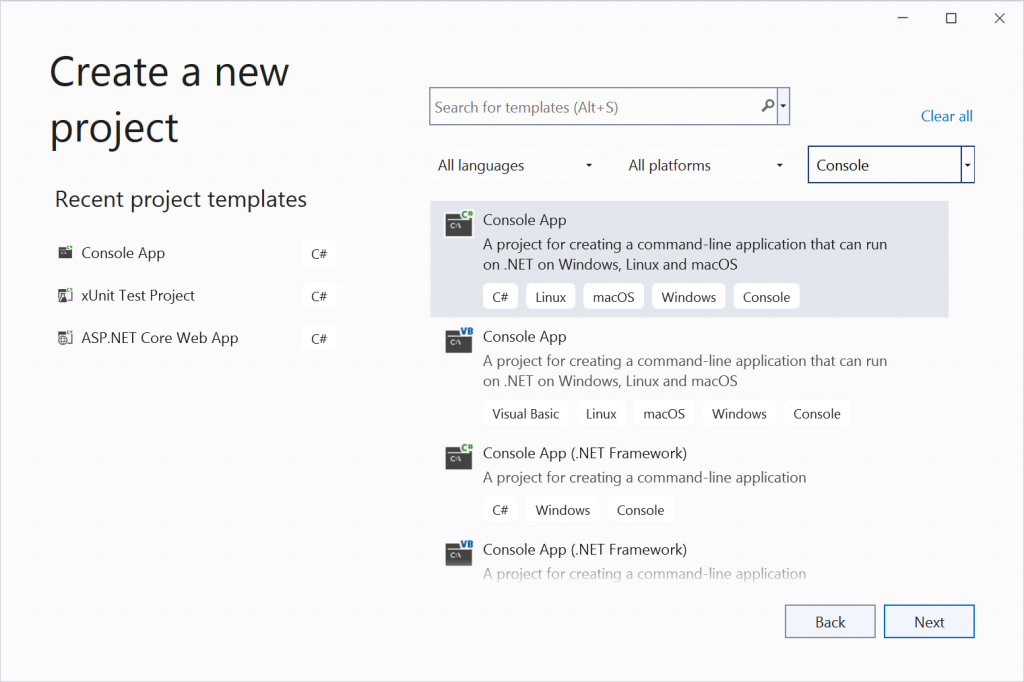
We’ll get started inside Visual Studio by choosing the “Console App” template from the new project dialogue.
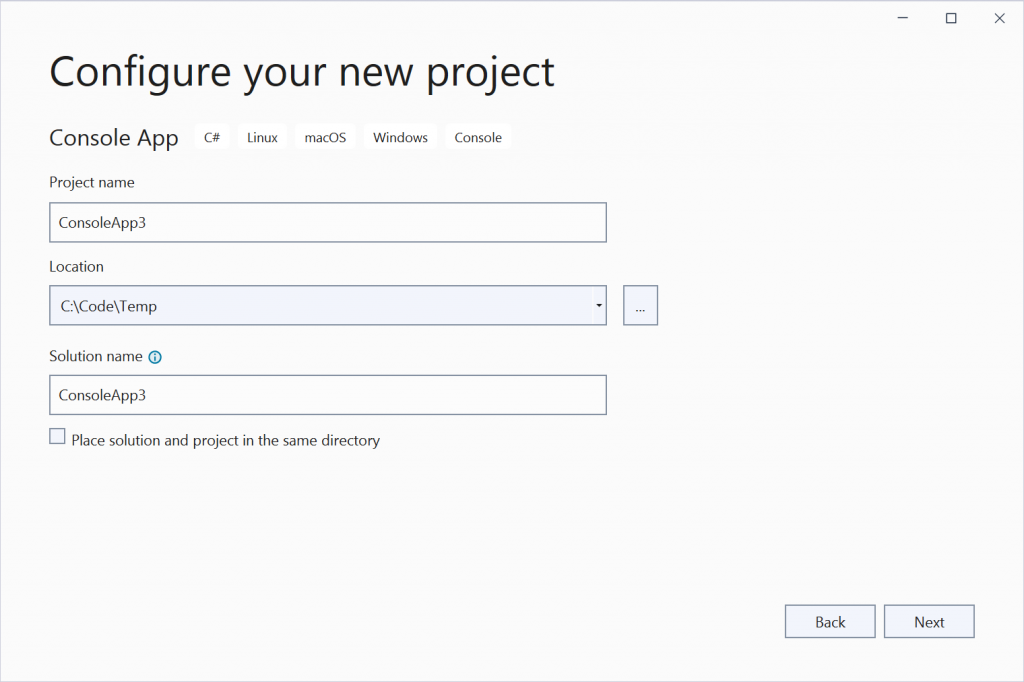
We provide a project name, location and solution name. This is only for fun, so you can see I didn’t choose anything fancy! Good old ConsoleApp3 it is. If I wasn’t writing this on a newly reinstalled machine, we’d probably be on at least ConsoleApp80!
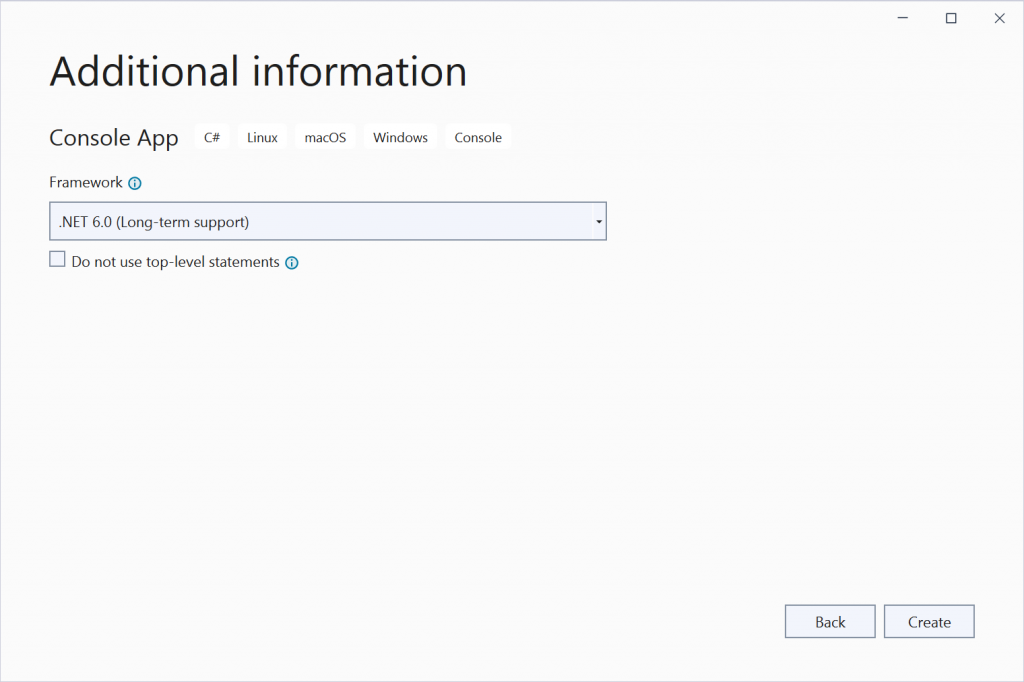
The console app template since .NET 5 and C# 9 uses top-level statements by default. We’ll use top-level statements here, but for those who are not a fan, in Visual Studio 17.2 and later, you can now check an option labelled “Do not use top-level statements” to prefer to classic template.
After a few moments, the relevant files are created and the Program.cs file is loaded in the editor.
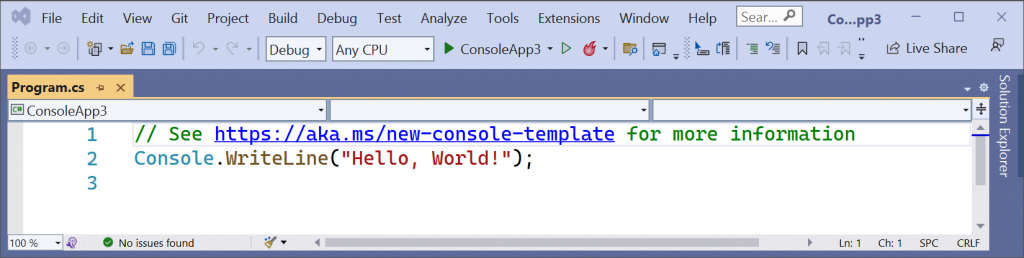
The initial application is already pretty basic but we can simplify it further. If we delete the existing code we can replace it with a single statement.
return;
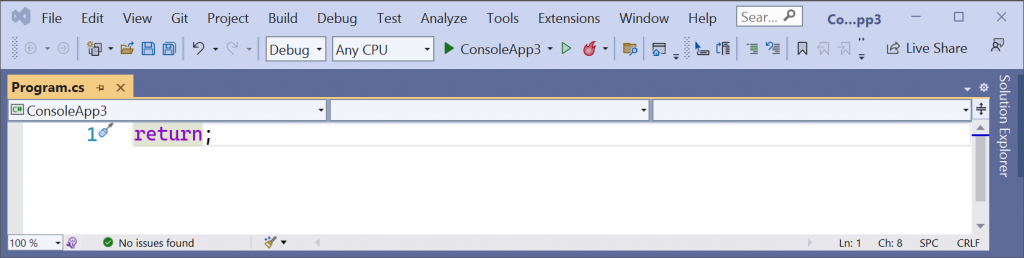
This is pretty much the smallest, shortest C# program we can develop at seven characters in length. Perhaps someone knows a trick to write something even shorter.
EDIT: It turns out, someone does. As nietras pointed out to me on Twitter, you can get down to two characters with an empty statement block {}. Nice! Check out their blog post for more details on that. So this is now, one of the shortest C# programs!
Our single line of code is a statement – it performs an action. C# is a programming language, and as with all human languages, there are rules that must be followed with regard to structure, syntax and grammar. The syntax of the language is formed of tokens which may be interpreted together to form larger constructs to represent declarations, statements, expressions, etc. In our line of code, we have a return keyword token, followed by a semicolon token. Together this represents a single statement that will be executed.
The return statement belongs to a group of statements known as jump statements. A jump statement transfers control to another part of the program. When a return statement is reached in a method, the program returns to the code that invoked it, the caller. To understand this particular jump statement, we will need to dig a little deeper in a few minutes.
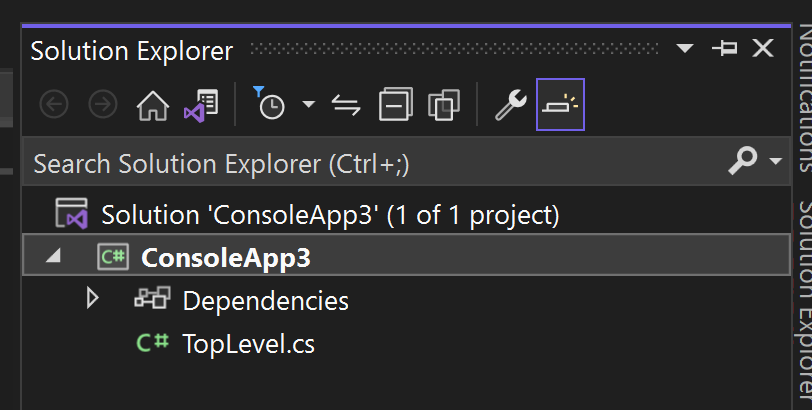
Before we run the application, I’m going to make one further change, just to help us distinguish things later in the post. I’m going to rename the Program.cs file to TopLevel.cs and save the application.
Executing the Application
We can build and run this application and as we might expect, it does very little. The output from the Visual Studio developer console is as follows:
C:\Users\SteveGordon\Code\Temp\ConsoleApp3\ConsoleApp3\bin\Release\net6.0\ConsoleApp3.exe (process 34876) exited with code 0.
Press any key to close this window . . .
If we execute the project using dotnet run with the release configuration from a terminal, we see nothing happen at all.
PS C:\Users\SteveGordon\Code\Temp\ConsoleApp3\ConsoleApp3> dotnet run -c release
PS C:\Users\SteveGordon\Code\Temp\ConsoleApp3\ConsoleApp3>
So, our simple application is valid and executes without an exception. It returns an exit code of zero which means it completed without error. The next question is, how? Was the runtime updated to support such programs?
The answer is, no, this is a compiler feature which appears to magically handle such code, producing a valid C# program during compilation. Let’s take a look at what actually happens.
Compilation “Magic”
The code we write in our editor or IDE can take advantage of many C# language features. When we build our application, the compiler takes our code and produces .NET IL (Intermediate Language) bytecode. IL (aka MSIL and CIL in some documentation) includes a set of common instructions and can be produced by compiling .NET languages. This intermediate form is a stepping stone to final machine code instructions. .NET achieves this through a process called Just-In-Time compilation. The JIT (RyuJIT) takes IL bytecode and produces machine architecture specific instructions, when methods are first invoked. We won’t dive into the finer details for now, the important point is that there are two stages to get to final machine code. The first stage, compiling to IL happens when we build our application, ahead of deploying it. The second stage, compiling to machine code occurs at runtime and is handled by the JIT compiler.
Some new language features may require runtime changes to support them but often this is avoided. Most features are implemented at compile time. These latter features use something called lowering to convert certain higher-level language constructs into simpler ones, that can then be more easily and optimally converted to IL. Lowering happens often and is generally not something we need consider too deeply. The compiler knows how to best convert the code we write, so that it can be compiled into the final IL.
Top-level statements are a compiler feature and some magic happens when we use them. Well, okay, it’s not magic, just a clever use of the compiler when various conditions are met in our code. We can learn a little more by decompiling our code.
Inspecting and Decompiling Code
In order to understand the mechanism which allows our short statement to become a valid C# program, we will inspect the generated DLL and decompile the code.
The DLL file, generated as output from the build process contains the IL instructions, along with .NET metadata used by the runtime to execute our managed code. One tool we can use to inspect the data within this file is ILDASM, which is installed along with Visual Studio. On my machine, I can open a Visual Studio developer command prompt and navigate to the directory containing the build artifacts for my console application, launching ILDASM against the DLL file located there.
ConsoleApp3\ConsoleApp3\bin\Release\net6.0> ildasm consoleapp3.dll
ILDAM loads, showing the types and metadata for the console application.
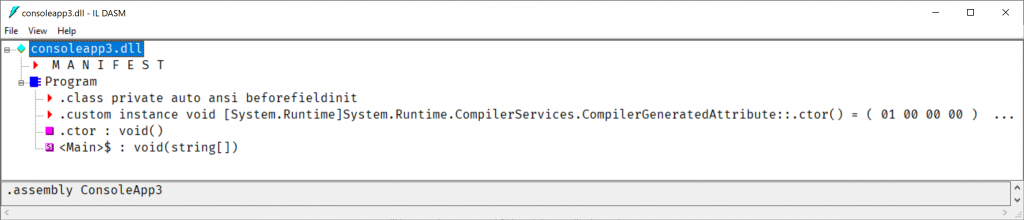
The most notable observation is that it appears we have something named Program that appears very much to be a class, and it is! It includes class metadata, a constructor method and one other method. This method is named <Main>$, and looks like a void returning method, accepting a string array parameter. Does that signature sound familiar? We could spend some more time in ILDASM, but let me switch to another decompiler tool. For this next step, we have a few choices, all of which are free tools.
All of these are valid options and mostly it comes down to a matter of preference. They have very similar features for the core functionality. I’ll use dotPeek which is the tool I tend to reach for most in these situations. After opening the DLL with dotPeek, we see a tree view of the assembly, not too dissimilar from what we saw in ILDASM.
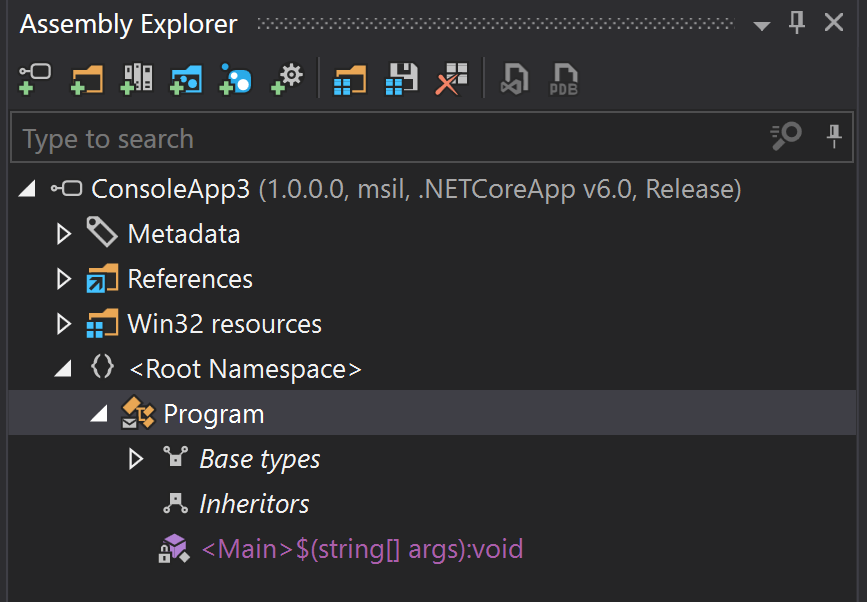
Below the Root Namespace, we can once again observe a Program class with a <Main>$ method. Where did this come from? We’ll answer that shortly. Before we do, let’s explore what else dotPeek can show us.
By right-clicking on the Program class, we can choose to view decompiled sources. This takes the IL code for the assembly and reverses the compilation process to return to C# code. The exact nature of the decompiled code may vary by tool. Sometimes, best guesses have to be used to decide how the original code may have looked and which C# language features may have been used.
Here is the result I get from dotPeek:
using System.Runtime.CompilerServices;

[CompilerGenerated]
internal class Program
{
  private static void <Main>$(string[] args)
  {
  }

  public Program()
  {
    base..ctor();
  }
}
The first hint as to what has happened here is the CompilerGenerated attribute on the Program class. This class did not exist in our code, but the compiler has generated (emitted) one for us. The class includes a static void method with a slightly unusual name <Main>$. This is a synthetic entry point which the compiler has produced on our behalf. Compiler generated types and members often have names with unusual symbols in them. Whilst such names are illegal in our own C# code, they are in fact legal as far as IL and the runtime is concerned. The compiler generated code uses these names to avoid potential conflicts with types and members defined in our own code. Otherwise, this Main method looks like any other we might include in traditional applications when not using top level statements.
The other method on the type is an empty constructor. I explicitly configured dotPeek to show this. Normally an empty default constructor can be skipped in our own code, but one is still added by the compiler if we do not declare one explicitly. This empty constructor simply calls the constructor on the base type, Object.
At this point, we start to see the “magic” of top-level statements at work. The compiler has several rules for determining the entry point of an application. One of the things the compiler now looks for are situations when our application contains a compilation unit containing top-level (global) statements. When such a compilation unit is found, the compiler will attempt to emit the standard Program class and main method at compile time. You’ll notice that even though we named our top-level statements file TopLevel.cs, this has no influence on the type naming for the synthetic Program class. By convention, new applications from the template have a single file named Program.cs which is mostly to remain consistent with the historical naming developers expect. I recommend sticking with the default name if you use top-level statements as other developers can still easily locate entry point code.
But hold on one second, I threw out a new term just then and we should roll back slightly. What is meant by compilation unit?
During compilation, the compiler lexes (reads tokens) and parses our code, eventually building up a syntax tree which represents the source code in a tree view according to the language specification. There are several ways to view the syntax tree but one that is very simple is to visit SharpLab.io. SharpLab is another extremely useful tool for inspecting decompiled and IL code in the browser. One other handy feature is the ability to view the syntax tree for our code.
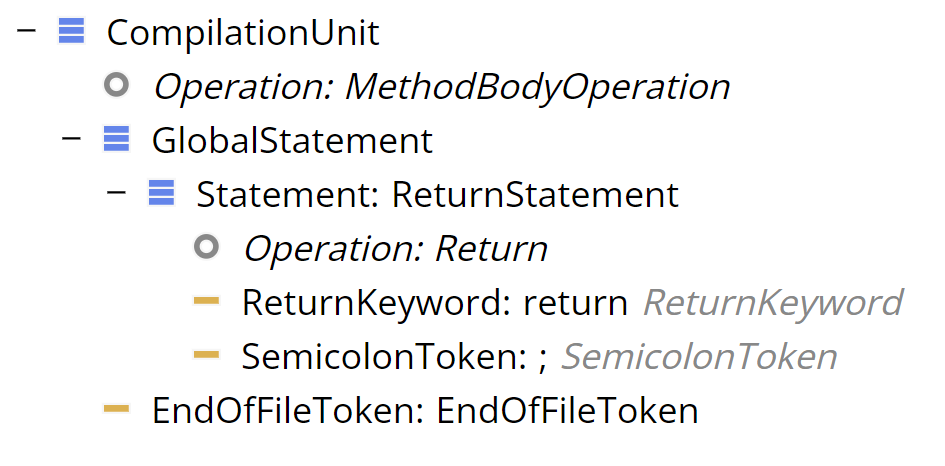
Our single return statement, from our TopLevel.cs file is parsed to the above tree structure, containing several nodes. The root of the tree is the CompilationUnit which represents our source file. As all of our code (yep, all one lines of it!) belongs to this file. Each element is a node under the root.
A return statement made up of the return keyword token and a semicolon token is all that this compilation unit holds. The return statement is found under the GlobalStatement node, which is how top-level statements are represented in the tree.
When the compiler encounters a CompilationUnit containing global statement(s), and no other CompilationUnit exists with global statements, the compiler is able to identify the use of the top-level statement feature and generate a synthetic main method inside a Program class. Our decompilation revealed the result of this process. The synthetic main method is empty in the decompiled source. Our top-level code included a single return statement. Any top-level statements will become part of the body of the synthetic main method. In our case, since we have an empty return, no explicit statement is required in the body of the method. It will return by default when the end of the method body is reached. When the end of the Main method is reached, our application has completed executing with an exit code of zero.
While we won’t go too deep with IL during this post, it’s worth wrapping up by exploring what the actual IL looked like. IL is a byte code format that is pretty terse. The decompilation tools all support a way to view the IL in a somewhat human readable form. Bear in mind that the actual instruction codes making up the method are often just one or two bytes each inside the DLL file. Here is the IL viewer output from dotPeek.
.class public auto ansi beforefieldinit Program extends [System.Runtime]System.Object
{
       .custom instance void [System.Runtime]System.Runtime.CompilerServices.CompilerGeneratedAttribute::.ctor()
    = (01 00 00 00 )

    .method public hidebysig specialname rtspecialname instance void .ctor () cil managed
    {
        IL_0000: ldarg.0
        IL_0001: call instance void [System.Runtime]System.Object::.ctor()
        IL_0006: ret
    }

    .method private hidebysig static void '<Main>$' (string[] args) cil managed
    {
        .entrypoint
        IL_0000: ret
    }
}
Stepping through this in detail is probably best reserved for a future post. We’ll focus our attention to the last block, which includes the information and instructions of the <Main>$ method. We can see a single IL instruction named “ret” in this method. The actual instruction code which appears in the DLL file is 0x2A. This statement returns from a method, potentially with a return value. If you’re curious of the finer points of IL and this instruction you can spend hours reading the ECMA 335 specification.
Here’s an except relating to the ret instruction:
Return from the current method. The return type, if any, of the current method determines the type of value to be fetched from the top of the stack and copied onto the stack of the method that called the current method. The evaluation stack for the current method shall be empty except for the value to be returned.
The generated IL doesn’t include anything being pushed onto the stack for our generated void returning method.
At runtime, the IL instructions are further compiled to the appropriate assembly code for the runtime machine architecture by the Just-In-Time compiler.
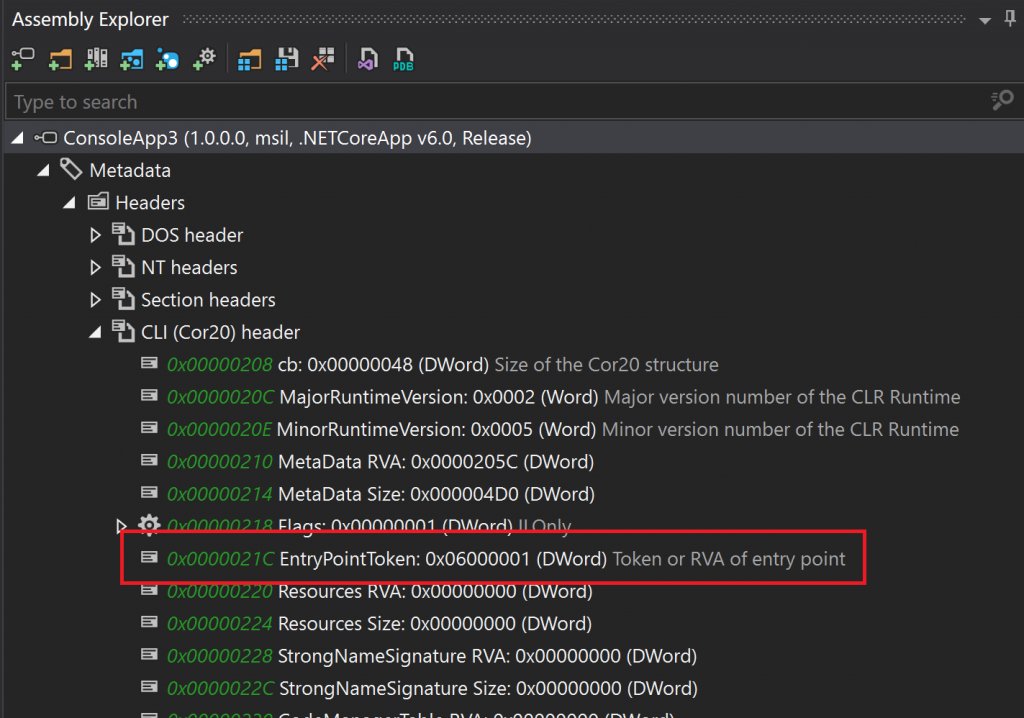
The one other interesting highlight is the .entrypoint at the top of this block. This can only be included on a single method from the application. The CIL header, part of the DLL file, includes an EntryPointToken which marks the method defined as the entry point.
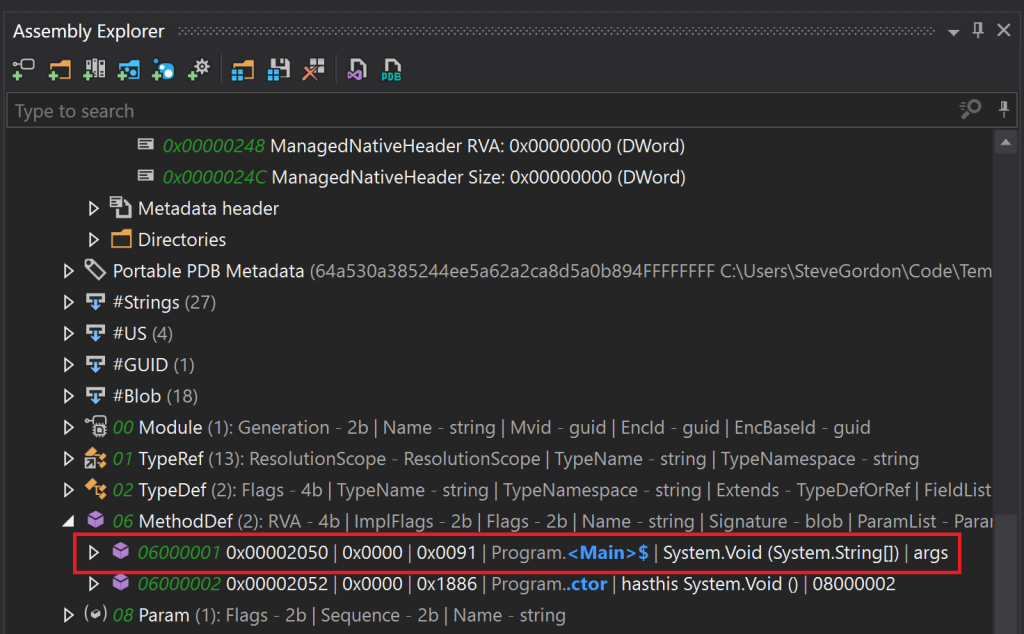
As part of the metadata about the application, a MethodDef table exists, which includes the method signatures for the assembly. We have two in our assembly, the compiler generated <Main>$ method and the default constructor for the synthetic Program class. You’ll notice the EntryPointToken value matches the identifier in the MethodDef table for the <Main>$ method.
When the execution engine, part of the runtime loads our assembly, it locates and starts executing our managed code at the entry point.
All our entry point does is immediately return. The return jump statement returns control to the caller, in this case the execution engine (runtime), and the application exits with code zero. Not very exciting in terms of functionality, but even so, it’s given me quite a lot to write about!
Summary
I think that’s probably a good place to end this exploration of this tiny C# program. There’s lots of other interesting things we could dig into, even in this small application. Perhaps, if there’s interest from people to read more about the inner workings, I’ll continue this as a series of posts focusing on some of those things. Personally, I find digging into some of the inner works to be quite interesting.
In this post, we created nearly the shortest C# program we could, compiled it and executed it. We then decompiled the DLL to understand how our single statement caused the compiler to emit a Program class with a synthetic entry point for our application. We learned that there is no “magic”, just a compilation feature which detects our use of statements directly below a compilation unit. The compiler took those statements and made them the body of the synthetic main method. Along the way we used some handy tools which can be used inspect the IL and metadata contained in .NET DLL’s, as well as decompile that IL back into valid C# code.
Have you enjoyed this post and found it useful? If so, please consider supporting me: