
In a previous post (Automating memory profiling with the JetBrains dotMemory Profiler API), I described the steps that could be used to automate the collection of memory snapshots and profiling data by using the JetBrains Profiler API NuGet package. In that post, we triggered the profiling session using the dotMemory application on Windows.
As part of the work I was doing, I also wanted to get some allocation data and snapshots for the application when running on Linux, since the code was expected to run there. This led me to the dotMemory Command-Line profiler tool. In this post, I want to describe the steps I followed to manually collect snapshots from Linux. In my case, I used WSL2 with an Ubuntu distribution which for the purpose of this post, I’ll assume is already in place. Of course, a Linux VM could also be used as well.
Using Windows Terminal I launched Ubuntu 22.04.
The first step was to ensure I had the code and profiling application available on the Linux system. I simply cloned my repository to a code directory under my home path on Ubuntu.
stevejgordon@DESKTOP:~/code$ git clone https://github.com/elastic/apm-agent-dotnet.git
The same application, as described in my previous post <LINK>, will be used to trigger the profiling of specific code paths. This is a simple console application which uses the JetBrains.Profiler.Api.
using JetBrains.Profiler.Api;
using Elastic.Apm.Helpers;
using Elastic.Apm.Tests.Utilities;
using static Elastic.Apm.Metrics.MetricsProvider.CgroupMetricsProvider;
using static Elastic.Apm.Tests.TestHelpers.CgroupFileHelper;

var paths = CreateDefaultCgroupFiles(CgroupVersion.CgroupV1);
UnlimitedMaxMemoryFiles(paths);

// WARMUP

var sut = TestableCgroupMetricsProvider(new NoopLogger(), new List<WildcardMatcher>(), paths.RootPath, true);
foreach (var metricSet in sut.GetSamples())
	foreach (var _ in metricSet.Samples)
	{
	}

// PROFILING

MemoryProfiler.CollectAllocations(true);
MemoryProfiler.GetSnapshot("Before GetSamples");

foreach (var metricSet in sut.GetSamples())
	foreach (var _ in metricSet.Samples)
	{
	}

MemoryProfiler.GetSnapshot("After GetSamples");
MemoryProfiler.CollectAllocations(false);
In order to use the Command-Line profiler from JetBrains, it needs to be installed onto the Linux system. There are a couple of options for this step. I’m going to go with manual installation as I’ll reuse the command-line tool in the future. It is also possible to grab a NuGet package which brings down the tooling that could then be hooked into a build workflow for CI automation. That use case is not something I’ve explored (for now). For a manual install, we can retrieve the latest (at the time of writing) compressed file using curl.
curl -L https://download.jetbrains.com/resharper/dotUltimate.2023.2.3/JetBrains.dotMemory.Console.linux-x64.2023.2.3.tar.gz -o dotMemoryConsole.tar.gz
This pulls the Linux x64 version in zipped format. You can find the zipped versions on the JetBrains website.
Having downloaded the zipped tooling, I prepared a couple of new directories under my home path.
stevejgordon@DESKTOP:~$ mkdir dotMemory
stevejgordon@DESKTOP:~$ mkdir workspaces
The first would be used to extract the dotMemory command-line profiler. The second would be a directory to store profiler session workspaces that we can later analyse.
I extracted the dotMemory zip file into the dotMemory directory.
tar -xf dotMemoryConsole.tar.gz -C dotMemory
At this point, we’re nearly ready to trigger a profiling session. First, we need to build the profiling application in release configuration.
dotnet build ~/code/apm-agent-dotnet/benchmarks/Elastic.Apm.Profiling -c Release
We can now execute the dotMemory command-line profiler to collect memory data, using the following command.
stevejgordon@DESKTOP:~$ ./dotMemory/dotmemory start --use-api --save-to-dir=~/workspaces ~/code/apm-agent-dotnet/benchmarks/Elastic.Apm.Profiling/bin/Release/net7.0/Elastic.Apm.Profiling
The command-line profiler accepts a command and several arguments.
The start command starts an application and gets snapshots by condition. We pass some arguments to control the profiling.
By including the –use-api argument, we instruct the tool to use the code in the profiling application to trigger allocation collection and snapshots. As we covered in the previous post, we can use APIs from the JetBrains.Profiler.Api package to control when and where we collect such data.
The above command also passes –save-to-dir so we can direct the output to the workspaces directory I created earlier.
Finally, we pass the full path to the dotnet executable that we built. This is the compiled version of the Elastic.Apm.Profiling console application.
After running this command, it writes its progress to the terminal.
Performs memory profiling of .NET applications

/home/stevejgordon/code/apm-agent-dotnet/benchmarks/Elastic.Apm.Profiling/bin/Release/net7.0/Elastic.Apm.Profiling

The profiler is running.

Press Ctrl-C to stop profiling

Profiler connected. PID:1513, Core CLR runtime v7.0.13.0
  [PID:1513] SNAPSHOT #1 SAVED.
  [PID:1513] Processing snapshot #1...
  [PID:1513] SNAPSHOT #1 READY.
  [PID:1513] Saving snapshot... ~5 objects
  [PID:1513] SNAPSHOT #2 SAVED.
  [PID:1513] Processing snapshot #2...
  [PID:1513] SNAPSHOT #2 READY.
  [PID:1513] SNAPSHOT #3 SAVED.
  [PID:1513] Processing snapshot #3...
  [PID:1513] SNAPSHOT #3 READY.
Profiler disconnected. PID:1513
Saving workspace...
WORKSPACE SAVED
file:///home/stevejgordon/workspaces/Elastic.Apm.Profiling.2023-11-30T12-45-36.464.dmw
The DMW file is a dotMemory workspace, containing the profiling data. To analyse it, we need to use the standalone version of dotMemory, a Windows-only application.
When using WSL2 as I am here, the easiest option is to navigate into the workspaces folder:
cd workspaces
From here, I can execute explorer.exe to open an explorer Window on my Windows host, targeting the location of the Linux filesystem.
explorer.exe .
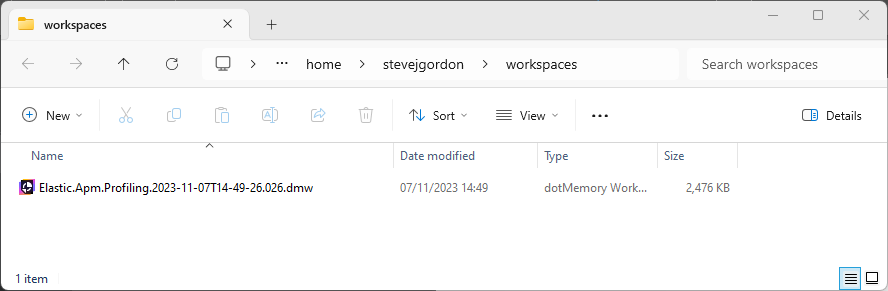
Since I have dotMemory installed on my Windows PC, I can simply double-click the DMW file to load it up in JetBrains dotMemory.
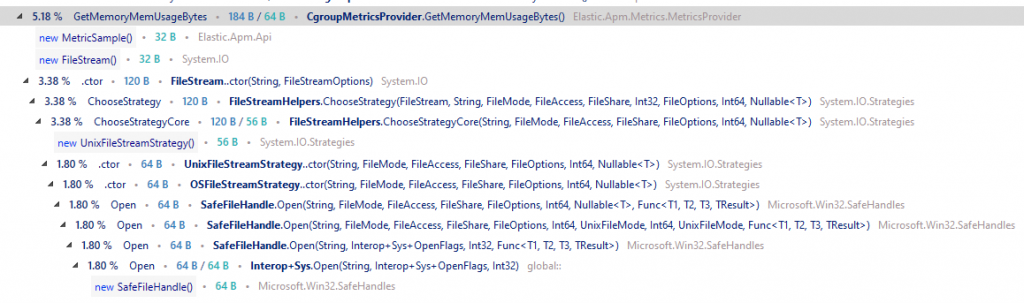
As in the previous post, I have three snapshots created through the profiler API. After comparing the memory allocations between the last two snapshots, I can now get a picture of the allocations caused by my code. We can see that this is from a Linux profile as we see the UnixFileStreamStrategy being allocated. This is a result of opening a FileStream in the application code.
When you need to profile and take snapshots of running code on Linux, the above steps are a simple way to capture data from Linux which in my case, was useful to understand how the code would function in its intended target. While the code can be executed from Windows for testing purposes, some of the allocations I saw were a side-effect of making things work in a simulated cgroup directory on Windows. The above results paint a true picture of the allocations and allowed me to identify that I could not avoid these as they are simply side-effects of the APIs from .NET that I needed to use. The allocations I could control have already been optimised in the profiled code used for this blog post.
Hopefully, this post proves useful if you too want to capture memory allocation information on Linux. Combining these techniques with WSL2 makes it easy, even for developers using Windows PCs as their development hardware to collect profiles from Linux with relative ease.
Have you enjoyed this post and found it useful? If so, please consider supporting me: