In the early days of ASP.NET Core 1.0, before Visual Studio 2017, back when we had the project.json project format, we were able to take advantage of a nice feature to enable source debugging of referenced libraries and code. We could add the paths of cloned source repositories into our global.json file and these would then be preferred over Nuget when available.
I used this quite extensively when writing some of my posts for my MVC Core anatomy series (something I hope to get continue with at some stage). I blogged about how we could set this up in this previous post – Debugging into ASP.NET Core Source. Unfortunately with the switch back to MSBuild and csproj, we lost the ability to easily debug through the ASP.NET Core source files.
Yesterday during the ASP.NET Community Standup Jon Galloway highlighted a tweet by David Fowler regarding new ASP.NET Core source linking support. Damian Edwards went on to provide some more detail about this new feature and afterwards I decided to take a quick look at it myself. I expect this post to serve as an early introduction to source linking and I will hopefully blog on more detailed elements once I’ve had time to explore them more fully. For this post we’ll focus on how we can get started with debugging into the ASP.NET Core source using source linking.
What is Source Linking?
Let me caveat this explanation with the fact that symbol files are not something I’ve previously messed around with besides knowing that PDB files existed. I’m coming at this blog relatively fresh. I’ll be explaining things as I’ve understood them so far and will happily make corrections and updates if necessary.
Like me, you may have noticed PDB files being created under some circumstances when compiling your code. These files hold the symbol information which can optionally be used to support debugging into external source. Some types of symbol files may contain some of that source code or mappings to the source code.
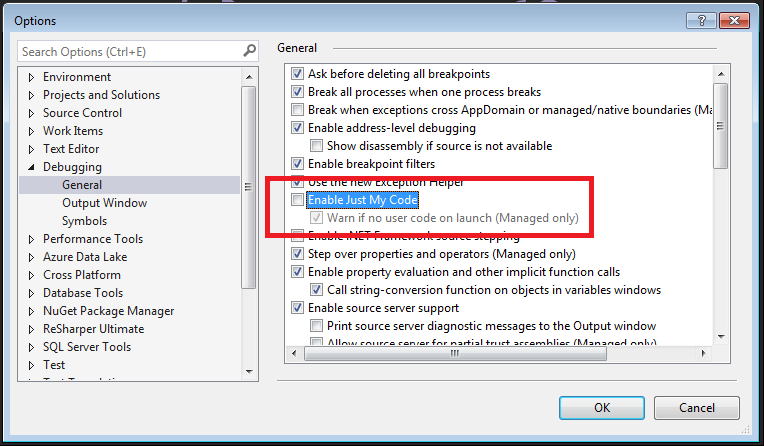
For a long time Microsoft have hosted Symbol servers which hold published symbol files for the Microsoft products such as .NET Framework and ASP.NET Core. Visual Studio supports downloading symbols dynamically. To do this you must disable the “Enable Just My Code” option in the Debugging > General options. By default this option is enabled in Visual Studio.
For more information on Symbols, Symbol Servers etc see this MSDN link.
Source linking allows you to embed a manifest inside the symbol file. For a given method name and location in the method that is being called it can identify what file contained the code and where it can be retrieved from. The ASP.NET Core libraries (not .NET Core currently) now support Source Linking and provide links to the code which is hosted on GitHub.
Enabling and Using Source Linking
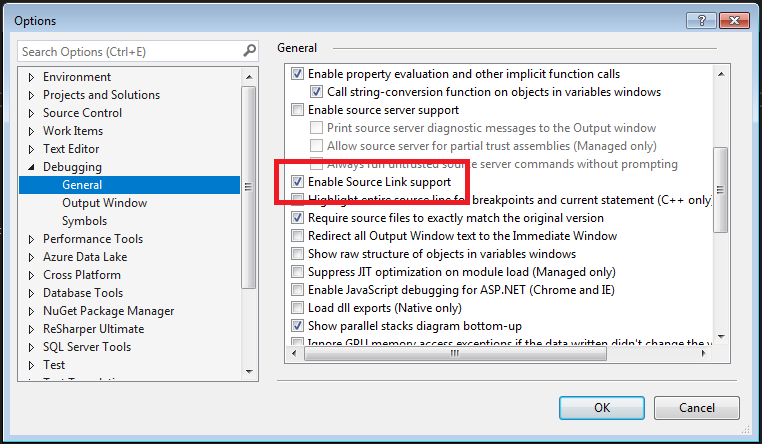
The first requirement is that you are running Visual Studio 2017 on the latest update (15.3) which added Source Link support. With this installed if you check the Debugging > General options you will see Source Link enabled.
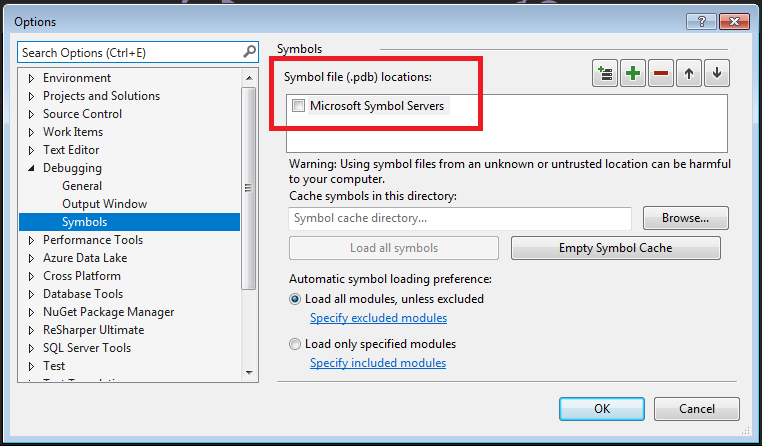
As well as ensuring “Enable Just my Code” is not checked you must also enable the Microsoft symbol servers. In the Debugging > Symbols options you can check the “Microsoft Symbol Servers” from the list of symbol file locations.
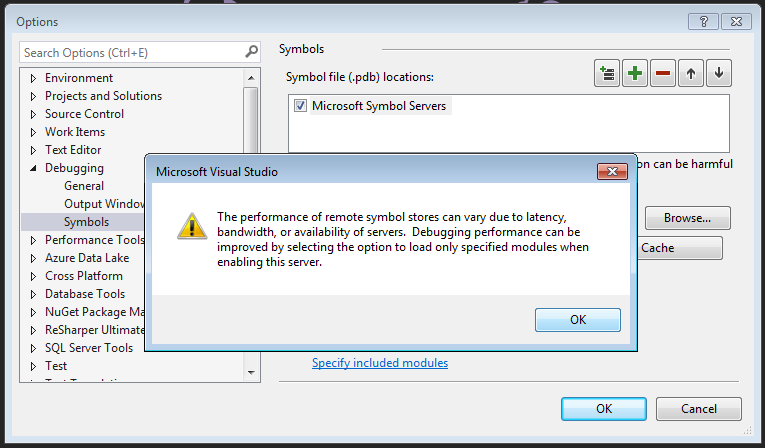
When enabling the symbol servers you will need to accept the possibly the performance impact that it may introduce when debugging.
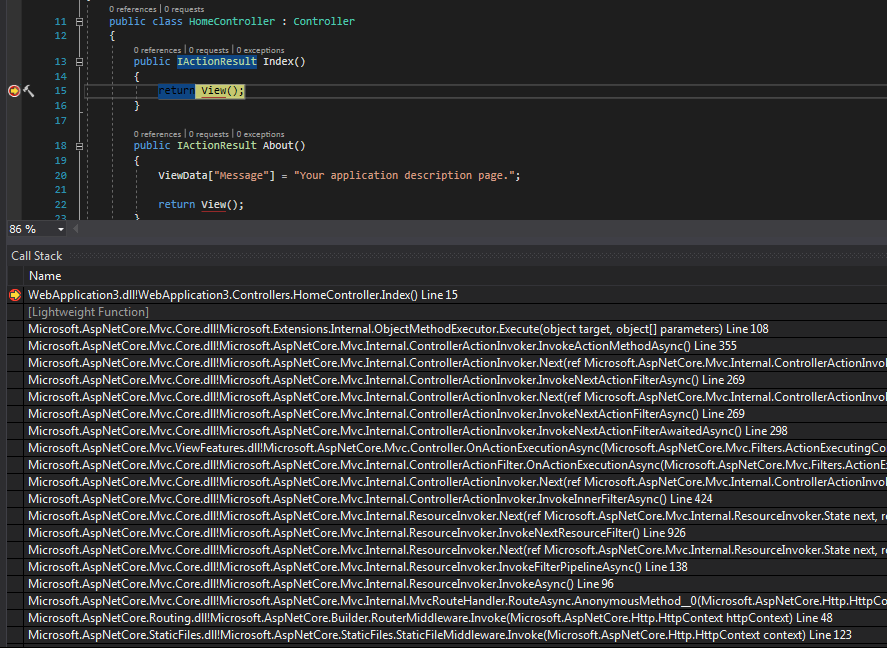
We are now setup and ready to debug into the ASP.NET Core source. To test this I created a default ASP.NET Core 2.0 MVC project inside Visual Studio. I then added a break point to the Index action on the HomeController. I then started debugging the application. The first time when debugging you may see messages like this in the status bar.
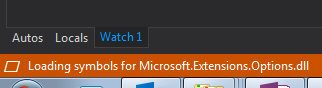
This is the symbol files being downloaded and may take a short while to complete.
Once you application is running and the breakpoint in your code is hit you can navigate down the call stack to see all of the external ASP.NET code that is being executed.
If you double click any of these calls the editor will use the symbols to determine where that code is located for the frame. Using the link inside the symbols file, Visual Studio will download the source file from GitHub. When Source Link needs to download source you will see a warning dialog like this:
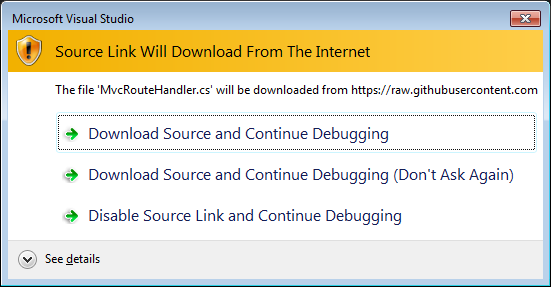
You can chose the first option to download for this specific source file and continue to debug using that file. If you chose the first option you will see this dialog for each new source file that is required. You can select the second option instead which will download the file and disable the warning for future files.
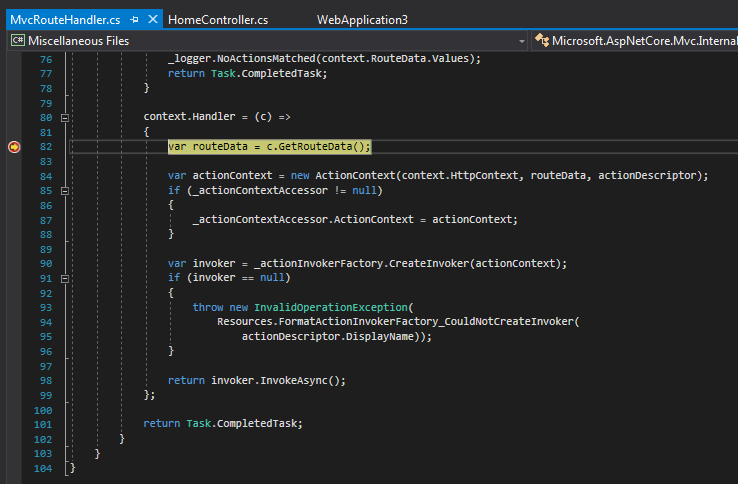
Now that we have the source it will be displayed at the appropriate location from the frame you selected.
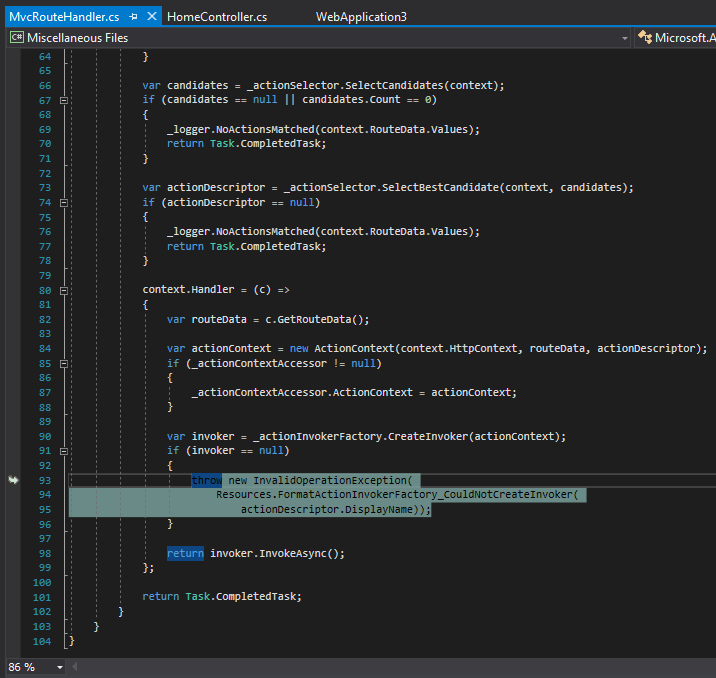
Now that we have the source file, you can also add your own breakpoint somewhere else within that file which will then be set to be hit when debugging your application. Even if we stop debugging and start again, this still seems to be hit successfully.
I was also curious about how we could set breakpoints in other parts of the code, without having to rely on access the source via the call stack. Damian mentioned a feature I’d never used where we can set a breakpoint manually from the breakpoint window. I have attempted to set a new function breakpoint up to one of the ASP.NET Core methods but so far I haven’t been able to get it working as Visual Studio states that the source is not available. I will pursue this and hopefully include details in a future post.
Summary
It’s great to see the beginning of easier debugging of external source coming to ASP.NET Core. Already there is value that I can gain from this feature to allow me to debug into the ASP.NET Core source to understand the internal workings. It’s not a sweet as what we were able to do back in project.json days but is certainly a step forward since we went back to csproj and MSBuild.
I miss the simplicity of cloning the full source for a repository and being able to navigate through it and add breakpoints to the external code. The source linking mechanism is good for more specific debugging cases where you want to dive into the external call stack. At the moment, once you have the source cs file via Source Link, you can’t navigate to other methods so exploring the code and setting further breakpoints is not possible outside of that file. If I can get the manual breakpoints working then that will be slightly better as at least I can view the source and determine methods I might want to break on, then set those up manually.
Chatting to David Fowler on Twitter I also understand that more features are being planned so I’ll be watching for those with interest. In addition, work is underway to get this supported by other non-Microsoft OSS projects such as Xunit and maybe in the future, JSON.NET. This repository (which I’ve not dug through yet) provides some build tools which can help creating source link symbols. I will also be looking at this more in the future.
Further References
Have you enjoyed this post and found it useful? If so, please consider supporting me:
Informative post Steve as always.
Is it possible to setup local symbol server for .net core and integration with Bitbucket? 🙂
Hi Goran.
I’m still learning but I haven’t seen anything on the code being in BitBucket so far. During my quite rapid research yesterday I did read that setting up a local Symbol server is possible. We use BitBucket Server for work so this is something I’d be interested in pursuing since it would be a nice way to easily debug into our internal libraries as well.
Steve
Hi Steve,
Thank for reply. We also use it and on large projects where we have different repositories for different purposes (usually libraries used across the system) and planning to use NuGet to distribute it. In this scenario local Symbol server with code debugging will be jack pot 🙂
Keep up good work!
Do you by any chance know the way to navigate through source code while not in debug mode?
What I would like is to have an ability to “ctrl + click” (R#) or “go to definition” the type from the library and have the sources loaded from the source server. Unfortunately, I wasn’t able to get this to work.
It’s something I hoped we might be able to do but it doesn’t seem to be supported at the moment. Agree it would be really nice to be able to download the source when attempting to navigate so we can dive in and set further breakpoints. Maybe this will be in the future plans?
Dear steve i’m still geting pdb not loaded for some library like Microsoft.AspNetCore.Mvc.Core
DO i need a particular symbol server reference other then microsoft ?
You shouldn’t have to add anything extra to get it working than described in the post. Are you able to share the exact steps you’re taking?
Nice feature! Thanks for the post
I’m using .NET Core 2.0 and the above doesn’t work for me. When I double click on a call stack entry I get assembly language. If I right click and select “Go to Source Code” it prompts me for a source code location. Can you help?
Hi Michael
Which frame are you selecting from the call stack? This will only work for ASP.NET Core related frames at the moment. When starting the project did you see the symbols being downloaded (orange bar in bottom left)?
Steve
It doesn’t seem to matter which call stack line I click on, none of them get me to source code (although I didn’t try them all). And yes, I saw symbols being downloaded. Curiously though a pop window would sometimes pop up with the msg: “Loading symbols for from: Microsoft Symbol Servers Attempting to cancel will disable further symbol loading”
Hi Michael.
Is this a new project or an existing one? I’d recommend trying this with a brand new ASP.NET Core 2.0 project first to validate if it works there.
Steve
I’m seeing the same issue as @@michaeldmcdonnell:disqus . Not sure if he got any solution. I also tried the steps explained by @reynouk:disqus at his blog post https://blog.reyno.co.uk/debugging-asp-net-core-source-code/ I’m trying debug through signInManger.PasswordSignInAsync method. When debugger hits breakpoint it says Source Not Available. This is a new asp.net core 2.0 project from built in templates. Any help
Regarding which frame I’m selecting from the call stack, it doesn’t seem to matter. I tried multiple times, but none got me to source code. And yes, I did see symbols downloading. I also saw the following popup a few times: “Loading symbols for (dll file name here) from Microsoft Symbol Servers. Attempting to cancel will disable further symbol loading”.
Hi @disqus_uBMOS1lS3g:disqus
I managed to successfully add a breakpoint and blogged about it here: https://blog.reyno.co.uk/debugging-asp-net-core-source-code/
That’s awesome. Thanks for sharing. I thought I’d even tried that at some stage, but evidently not. That’ll prove very useful.
How can I debug Aspnet Core source code with VS Code?