
In my last post, which is part of my ‘Writing High-Performance C# and .NET Code‘ series, we looked at how we can begin interpreting some of the data from a dotMemory profiling session.
In this post, we’ll continue the analysis by investigating why we saw that the Large Object Heap (LOH) size grows for about 200ms after the first snapshot occurs.

In this close-up of the timeline graph, the purple area represents the size of the LOH. It hits a size of 401.2 KB and then stays level for the remainder of the profiling session.
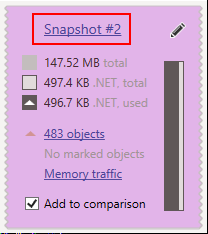
My profiling session includes two snapshots. The second snapshot occurs after the profiled code has completed loading and parsing 75 files.
To begin this investigating we’ll click on the title of “Snapshot #2”.
This will load an analysis window. Our goal is to investigate the Large Object Heap specifically, so we can open the ‘Generations’ tab.
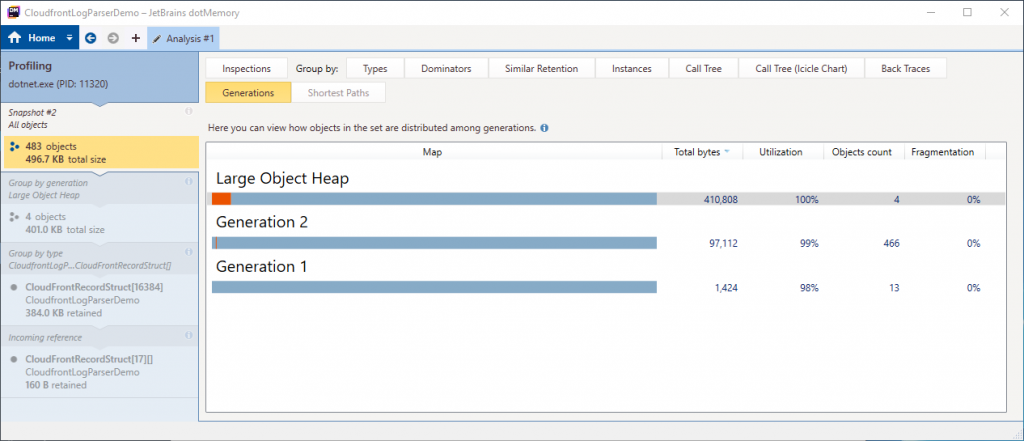
Here we can view the sizes of each heap generation. The LOH is a total of 410,808 bytes in size, which is made up of 4 objects. We’ll double click on the Large Object Heap to dig into the details.
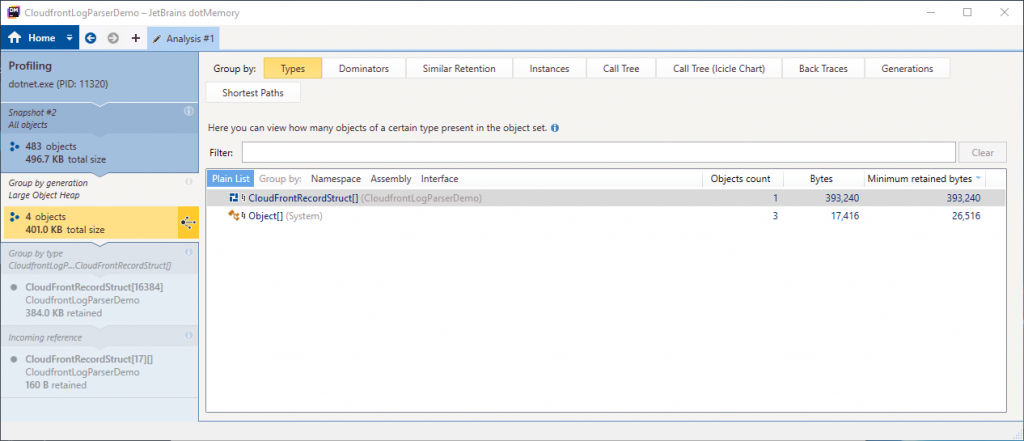
We now have a view where we can see the types which are allocated in the Large Object Heap. In this view, the majority of the heap is occupied by a CloudFrontRecordStruct array. We’ll double click that item to continue investigating.
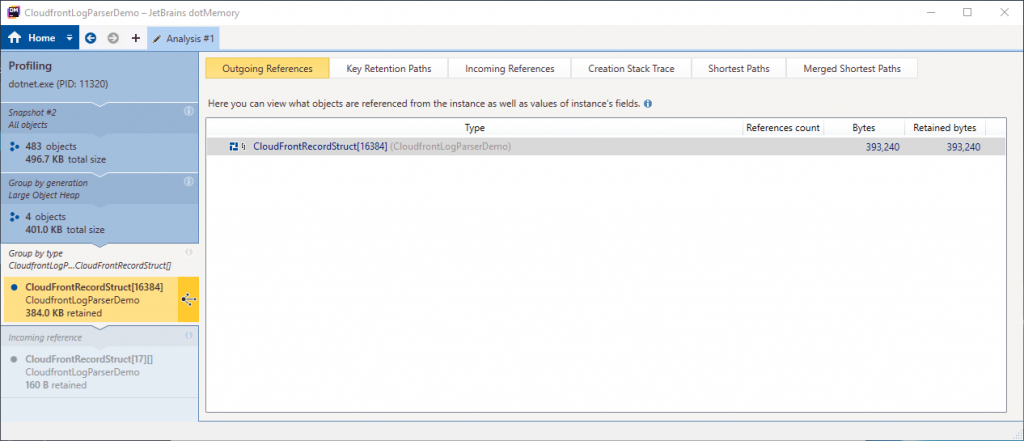
We can now see the outgoing reference to that type. An array with capacity for 16,384 CloudFrontRecordStruct elements. Where has this come from?
The application being profiled uses an ArrayPool<CloudFrontRecordStruct> to rent an array which is passed into the ParseAsync method.
In this code, under profiling conditions, we’re simulating the processing of 75 files. Each of these is processed sequentially, so we only ever use one item from the pool at any one time. In the real-world scenario, it’s possible that parallel file processing will occur. For this sample, we could have created an array and simply reused it for each file, rather than renting it from the pool.
We now know what instance is occupying the majority of the LOH memory. Let’s continue thinking about this object. Why is it in the Large Object Heap and what accounts for its size of 393,240 bytes?
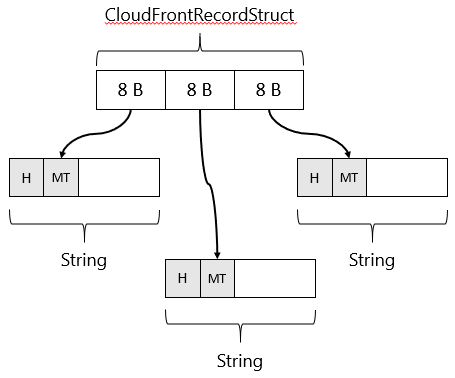
Let’s start by looking at the CloudFrontRecordStruct definition.
It has three string properties which will hold the data we parse from the CloudFront log file.
A struct has no overhead so its size can be computed from the size of its members. In this case, the struct holds three references to strings on the heap. On my 64 bit machine, a reference to an object on the heap is 64 bits or 8 bytes in size.
Therefore, 3 x 8 bytes = 24 bytes in total needed per CloudFrontRecordStruct.
In this sample, I know that my that test file holds exactly 10,000 items, so I requested a length of 10,000 elements as the argument when renting the array from the pool.
We can clearly see from dotMemory that the array we have been provided from the pool has a capacity of 16,384 elements. So why is it bigger than the 10,000 we requested?
The shared ArrayPool, which I’m using in my code, works by pooling arrays into buckets of certain sizes. The shared array pool is an instance of TlsOverPerCoreLockedStacksArrayPool. This pool has 17 buckets, starting with a bucket for arrays of 16 elements and then increasing by powers of 2 for each bucket. 16, 32, 64, 128 etc. Up to a maximum array size of 1,048,576 elements.
In this sample, I rent an array for 10,000 elements. The smallest bucket size which can provide a suitable array is the bucket containing arrays of 16,384 elements; 2^14.
So our array can potentially hold 16,384 elements and we can now compute its actual size by multiplying the known size of the struct by the capacity. 16,384 x 24 bytes per item is a total of 393,216 bytes.
That leaves 24 bytes unaccounted for! An array is a reference type and in .NET, reference types have some overhead. The array also needs to store its length. All-in, on my 64-bit system, the additional cost is 24 bytes. 393,216 bytes + 24 bytes = 393,240 which is exactly the size that dotMemory is reporting.
So, we now understand why we have seen this array in the snapshot data. The final question is why is it in the Large Object Heap? That’s an easy one! Any object larger than 85,000 bytes is allocated in the Large Object Heap. We’re well above that limit so the memory occupied by this instance is immediately allocated from the LOH.
Since we’ve rented this array from the shared ArrayPool, it will live for the life of the application. The code can keep re-using the same instance from the pool. Again, in this sample, pooling is a bit redundant. In the real-world scenario, pooling may have a more positive benefit for parallel processing. Even then, it’s dependent on how that application is written and should be profiled and benchmarked.
Summary
In this post, we’ve learned a few more techniques for drilling into the information available in dotMemory after profiling an application. With the help of the data, we’ve been able to interpret and understand the cause of the allocation in the Large Object Heap. Given what we know about this application, we can see that this allocation is reasonable and not something which is concerning.
Have you enjoyed this post and found it useful? If so, please consider supporting me: