
In my last post, which is part of my ‘Writing High-Performance C# and .NET Code‘ series, we looked at how dotMemory can be used to view the amount of memory allocated by code in an application using the memory traffic comparison.
In this post, I’ll begin looking at some of the other information available in the dotMemory workspace after profiling an application. Specifically, we’ll begin by looking at the timeline graph. As with the previous post, I’m profiling some sample code which can be found in my GitHub repository.
The main workspace view includes a memory timeline graph which you can use to see the sizes of the different generations of the managed heap over time. Here’s the view after the profiling session described in the last post.
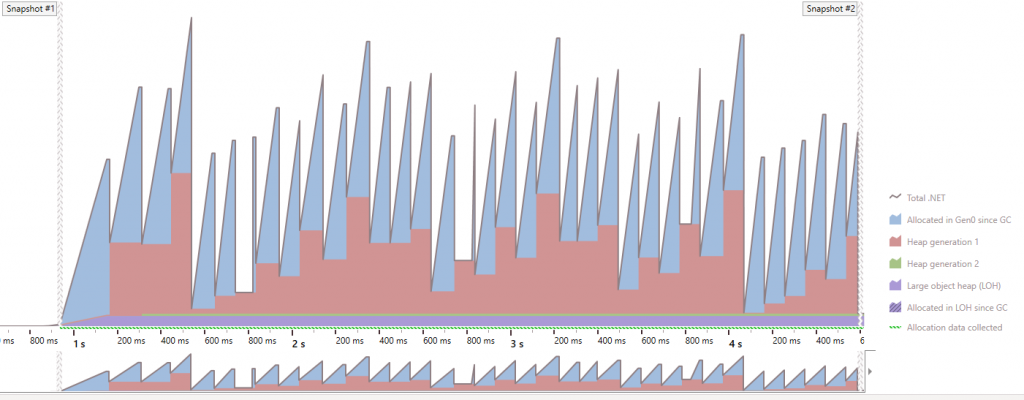
What does the Timeline Graph Show Us?
Firstly, we can see the sawtooth nature of the Gen 0 heap. If we consider the workload of this application, we can start to reason about the picture this graph presents. The code being profiled reads a file, parses out some of the data into objects and finally adds them to an array (from the ArrayPool). During profiling, the code runs in a loop, processing 75 files.
Whilst my code has been optimised, the workload allocates many reasonably small strings which form the output of parsing the contents of the file. The steady growth of the gen 0 heap is caused by the allocations of these strings. The sudden drops indicate that a garbage collection has occurred.
At the beginning of this graph, we can see that typically the generation 1 heap size increases at the same time as the generation 0 drop. This indicates that some of the objects are still referenced and cannot be collected. As a result, they survived garbage collection and are promoted to generation 1.
From time-to-time, the generation 1 size drops also, which indicates a generation 1 collection (or greater) has occurred. Significantly, we see that the gen 2 heap doesn’t grow, so we can infer that objects are likely not surviving the generation 1 collection. The generation 1 collection also results in generation 0 objects being collected.
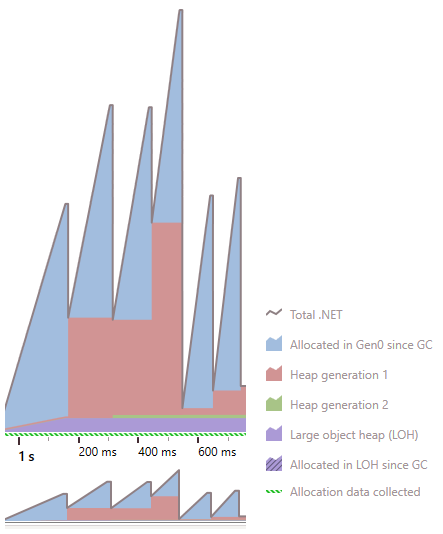
The Large Object Heap (LOH) grows quickly within the first ~200ms after the first snapshot but then remains steady. So we have something allocating in the LOH near the beginning of the application. We’ll investigate that in the next post!
For the code we’re profiling, this graph looks reasonable. We know that we’re allocating around 30,000 strings for each of the 75 files we process. The parsed objects are stored in an array, which at the end of each loop is returned to the ArrayPool. In this sample, the array is cleared when it is returned to the pool, so at that point, the strings are no longer referenced. When the next garbage collection occurs, they get collected. In some cases, we can assume a garbage collection of generation 0 must be occurring whilst the array of parsed objects is still being populated. As a result, whilst those objects are still in the array, they survive the collection and hit generation 1 for a short period of time.
The key thing is that we’re not seeing a constant growth in any of the generations and the gen 2 and LOH sizes stabilise to a constant size shortly after the file processing begins.
This view is useful to see the big picture of the managed heap sizes during the execution of our code during profiling. In future posts, we’ll dig into the other views to see what else we can learn using the profile results.
Thanks for reading! If you’d like to read more about high-performance .NET and C# code, you can see my full blog post series here.
Have you enjoyed this post and found it useful? If so, please consider supporting me: